Translate this page into:
Documentation of Prognostication Discussion

*Corresponding author: Jyothi Jayan Warrier, Pain and Palliative Care Society, Institute of Palliative Care, Thrissur, Kerala, India. jyothijayan2003@yahoo.co.in
-
Received: ,
Accepted: ,
How to cite this article: Edassery DE, Chittezhathu RK, Warrier JJ. Documentation of prognostication discussion. Indian J Palliat Care 2021;27(2):222-9.
Abstract
Background:
Our organization is a NGO that provides palliative and supportive care at outpatient (OP), home visits and inpatient (IP), and Hospice settings. During patient encounter at different settings, documentation of discussion on prognostication was not done on the patients’ case sheets. This had created communication gap between the professionals, the patients and their family members. Due to this, there was a mismatch between the patients’ expectations and the services provided.
Aims:
The aim of the study was to implement A3 protocol and to increase the documentation status from zero to 75% by the end of five months after the commencement of the project.
Settings and Design:
OP - Department of Palliative Care Clinic A3 method.
Material and Methods:
The process map of the newly registered patients was followed. Root cause analysis was done using the Ishikawa Diagram. The main cause was that there was no specific format for documentation of prognostication. The professionals also felt some difficulty in disclosing the information as they were not following any prognostication tools upon which such discussions can be made. The key drivers were identified. Interventions were focused with specific contributors. A run chart was maintained to assess the progress of the interventions
Statistical Analysis Used: Percentage calculation.
Results:
This endeavor has resulted in raising the documentation status from 0 to 80%.
Conclusion:
A3 protocol has been successful in developing the format for documentation of prognostication. Our team has gained confidence in implementing the A3 in other domains too.
Keywords
Documentation
Prognostication
A3 format
SMART goal

INTRODUCTION
Background
Our organization registers an average of 1200 new patients every year. We provide palliative and supportive care at outpatient (OP), home visits and inpatient (IP), and Hospice settings for cancer and non-cancer patients. When a patient first reports to the unit, usually at the OP wing, a trained volunteer collects the basic information about the patient and the family. Then, the professionals (doctor and nurse) make the assessment and treatment plan. Based on the care plan, we provide care through a multidisciplinary team.
Discussion on prognostication with the patient and/or the family at the time of registration was not documented which had been creating two problems
Communication gap when different people involve in the care delivery at multiple levels (OP/homecare/IP)
Mismatch between the expectation from the patient/ family and the care delivery of the team.
Aims and objectives
After understanding the background and identifying the gaps, our aim was to achieve documentation of discussion on prognostication in 75% of the newly registered cancer patients and/or the principal family members, within a span of 5 months with effect from March 2018.
We joined a quality improvement program QI PC PAICE India 2017–2018, in collaboration with Stanford Health Care, USA. It was a pilot study involving seven palliative care providers in India. Under their guidance, it was decided to implement A3 protocol.[2]
METHODS
QI concept and the A3 thinking
A3 tool tells us the story of our improvement journey on one sheet of paper, the A3 template. The A3 process allows groups of people to actively collaborate on the purpose, goals, and strategy of a project in a complex environment. It encourages in-depth problem solving throughout the process and adjusting, as needed to ensure that the project most accurately meets its intended goal. The term “A3” is derived from the particular size of paper used to outline ideas, plans, and goals throughout the A3 process. Following the A3 methodology was a new skill acquired during the learning process. The following contents are portrayed on the A3.
Project title
It is very important to have a title for the project and state names of sponsor, team leads, and team members. Our project title was documentation of prognostication discussion.
Problem statement
Defining a problem statement is the first and the most important task when we begin a quality project. It is stating “what” the problem we are trying to solve is. Based on our background, and discussions with the multidisciplinary team members, we were able to define a clear problem statement. Our Problem statement was Discussion on prognostication with the patients and family members is not documented, at registration to the Palliative Care unit.
Specific, measurable, attainable, relevant, and time bound (SMART) goal
The SMART goal was set to increase the documentation status from 0 to 75%, which was measurable, relevant and attainable according to the team. A period of 5 months from the commencement of the project was set to achieve this goal.
To bring out a specific goal, team discussions were held. We concluded that, aforementioned problems were created as a result of not documenting the discussion on prognostication with the patient/family at the time of registration to our Palliative Care Unit. This was to be done by the palliative care physicians who first met the patient/care giver. After consulting the team of physicians, a SMART goal was set to increase the documentation on prognosis in case records of newly registered cancer patients, from 0 to 75% by the end of five months after commencement of the project.
Process map
The team now went back to where the process or work is actually taking place or did the Gemba Walk.[1] Gemba walk denotes the action of going to see the actual process, understand the work, ask questions, and learn. It is an opportunity for staff to stand back from their day-to-day tasks to walk the floor of their workplace to identify wasteful activities. The team observed the processes, took feedback from multiple people and documented step by step. It helped us to learn thoroughly about the current processes and the wastes resulted due to various reasons. The team also ensured that the scope of the process is something the project team can influence.
Wastes
TIM WOODS’s improvement process was applied to focus on understanding the wastes. TIM WOODS is the classification of the wastes as transportation, inventory, motion, waiting, overproduction, over processing, defects, and skill.
We observed that the current problem of communication gap resulting in mismatch between the expectation from the patient/family and the care delivery of the team was creating wastes of motion, over processing, defects and skill.
The process map of the patients getting registered in our organization is quite complex consisting of 13 steps as shown in Figure 1.

- Prognostication was missing in the process map before implementing the project.
Root cause analysis
Treating the symptoms may provide a temporary solution but it may not help us to reach the real cause of the problem which is the root cause. It may reappear if not identified and solved.
Our team analyzed the root causes for our problem and listed them using a tool called Fishbone diagram or Ishikawa diagram [Figure 2].
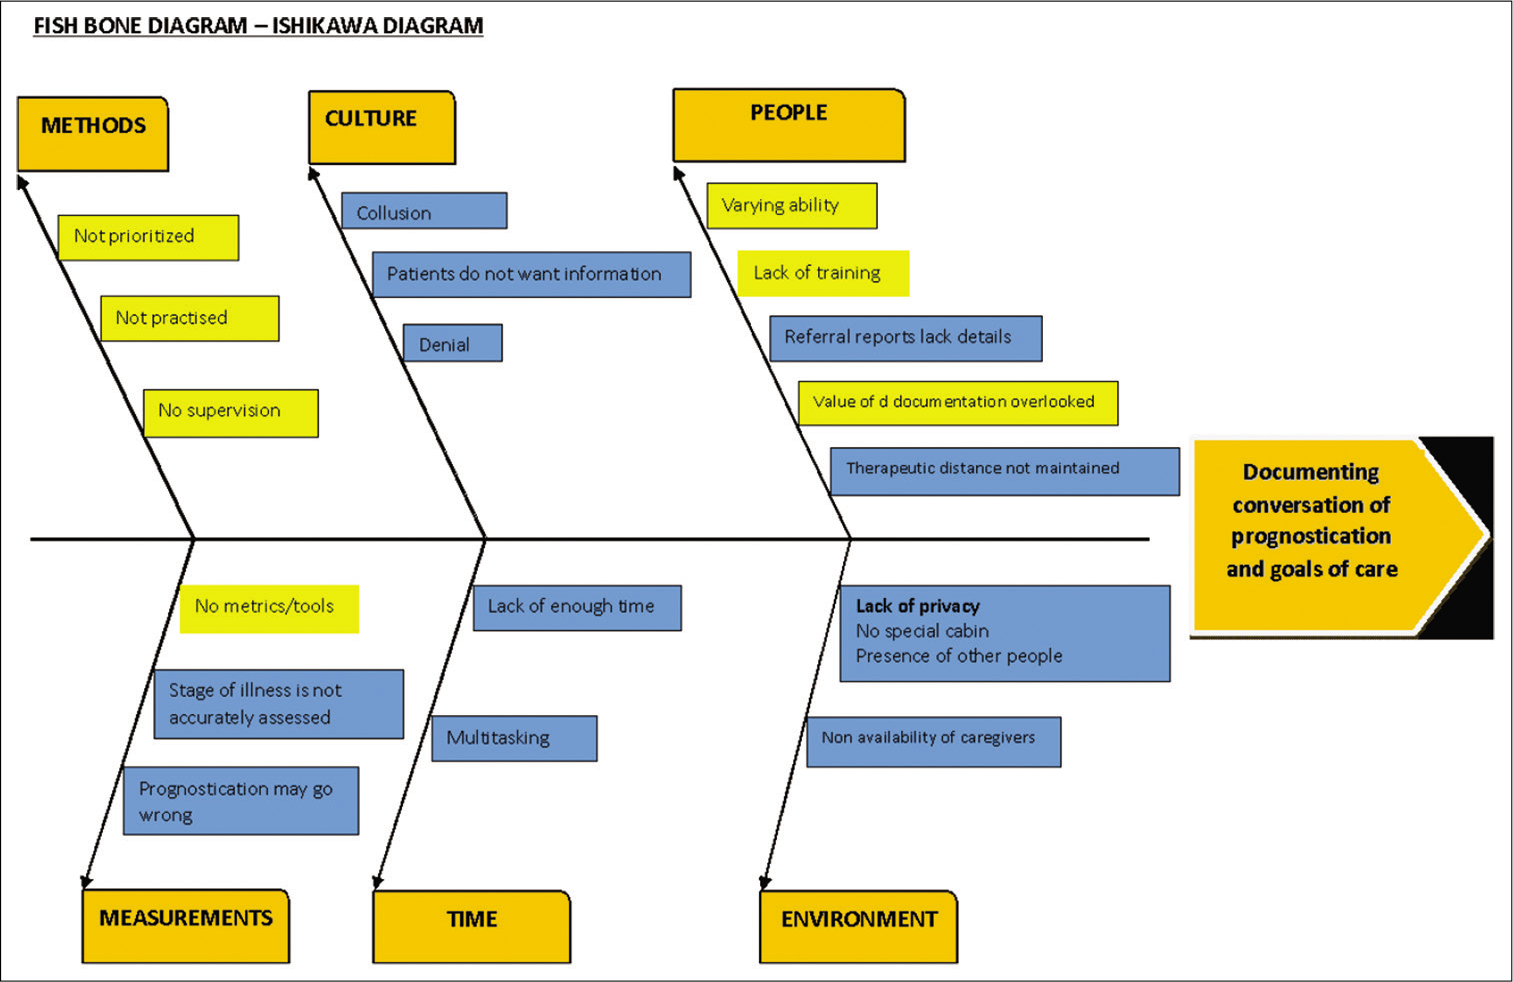
- Root cause Analysis done using Fishbone Diagram / Ishikawa Diagram
We found the most significant of them were:
No tool for assessing prognostication
No definite format for documentation
There was no clarity of information shared
Professionals had found the discussion difficult because of the cultural issues
Variation in ability to communicate among professionals.
Our team came to a consensus that the most impactful cause was, there was no definite tool to assess prognostication for documenting the discussion.
Run chart
To measure the result of our interventions, we used a Run chart on A3. The X-axis showed the weeks and Y-axis showed percentage of documentation.
Run chart provides a perfect visual of the measures on a graph. It shares the story of where we are, where we want to be, how much time we have to get there and what the journey has been like. Run chart helps to reach a shared understanding about what the data is telling us.
We started to plot on a run chart, our current status prior to commencement of the project. As we were not in a practice of documenting the prognostication discussions, our current status was 0% on the Y-axis. This was our baseline data which we identified during the Gemba walk.
The weekly score and percentage of prognostication discussions documented in the case records of newly registered cancer patients were entered on the run chart. Later the interventions were added as annotations. This clearly showed the impact of the interventions.
Understanding current status and measures
To understand the current status and the progress later, it was necessary to define measures. QI categorizes measures into three.
Outcome measures
This measures the performance of a system. Our outcome measure was patient/caregiver satisfaction by filling communication gaps occurring due to the missing documentation of prognostication discussion.
Process measures
This is measuring the performance of a process. The process of entering details of a newly registered cancer patient in patient files should include documentation of prognostication discussion also. There should be a standard format for this.
Balancing measures
While implementing the improvement process, physicians making the discussions on prognostication should feel comfortable and confident, and the recording procedure should not be too much time consuming
Key drivers, interventions, and reliability levels
After discussion in team meetings, key drivers and interventions [Figure 3] were identified based on the root causes.
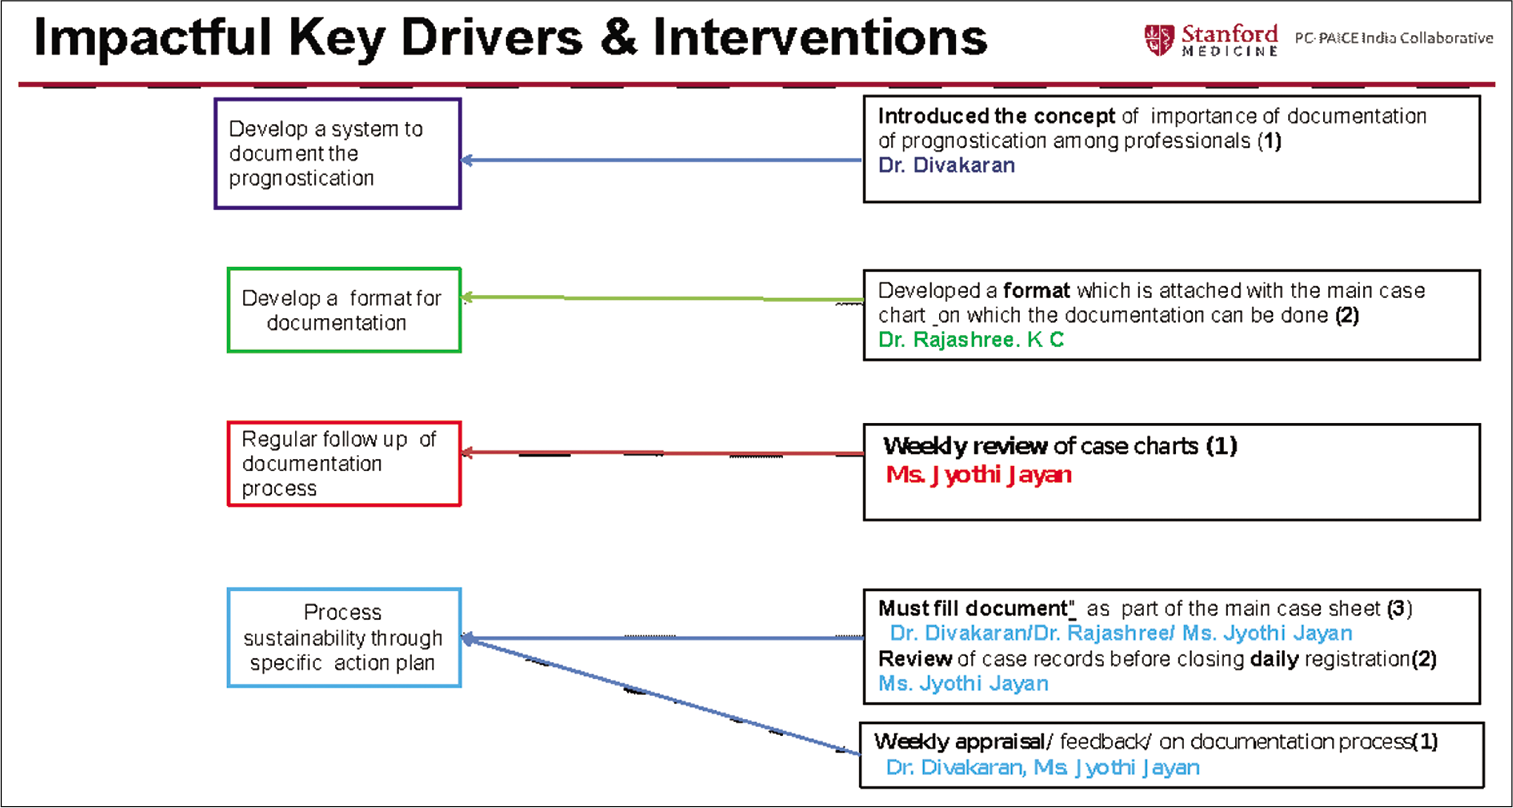
- Impactful Key drivers and Interventions to achieve them with their Reliability Levels
Key drivers are sub goals that must be introduced into the system to reach our goal. These sub goals support the final project goal. Our impactful key drivers were
To develop a system of documentation of prognostication
To introduce a format for documentation
To review the case sheets regularly to ensure the follow up was properly done
To bring in a system so that level 3 reliability would be achieved.
Interventions are specific changes to improve the outcome. While planning interventions we have to see that each intervention is tied to at least a key driver and we should consider multiple interventions to result in a key driver. The interventions that would result in impactful key drivers were planned.
To reach the key drivers we designed a plan of interventions as follows
Developed a format [Appendix 1] for documentation of discussion of prognostication based on Palliative Performance Scale – PPS [Appendix 2]
Format was pilot tested among the doctors and they found it simple and easy to follow
Weekly review of case records was done.
Our interventions also included regular meetings with the professionals to convince them on the importance of introducing the system of documenting prognostication and review meetings of the same. These interventions were marked on the run chart as annotations. The interventions were tested and fixed only if they were found to bring the necessary improvement. We changed or even dropped the intervention/s in the course of the project until we achieved the desired result. This was done in PDCA (PlanDoCheckAct) model which is a four-step model for carrying out change. It is a continuous loop of planning, doing, checking, and acting and provides a simple and effective approach for solving problems. The results appeared on the run chart only if we were consistent in entering the data [Figure 4].
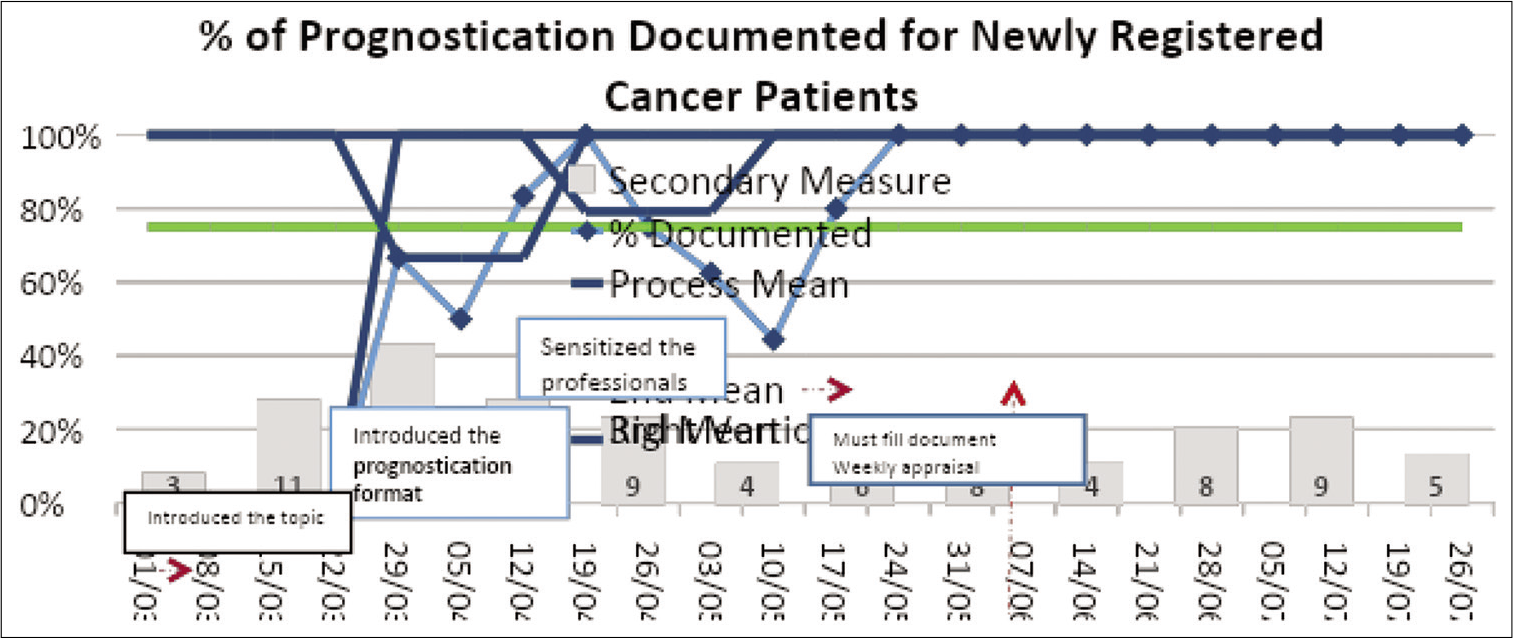
- Run Chart which is a visual representation of what the journey has been like
The QI project led by the Stanford Health Care team has helped us in simplifying and streamlining the documentation process on discussion on prognostication using A3 protocol. At the end of 5 months, we were able to achieve the documentation status of 80% against the 75%, which was the target [Figure 4].
Reliability levels
The reliability levels are based on the ongoing efforts of the project and are determined by the result of each intervention or measuring procedure. Level 3 reliability encompasses complete analysis of the problem and also involves the integration of the multidimensional interventions which are made so as to ascertain sustenance and internal consistency. Feedback, training, and new standards are Level 1 reliability. A redesigned process step denotes Level 2 reliability. A built in feedback and automation help us to achieve Level 3 reliability.
When the project team develops interventions that fall into Levels 2 and 3 reliability, a sustain plan is in place.
Sustainability of the project
Regular follow-up is pivotal in the sustenance of any quality improvement program. Hence, we periodically reviewed all case records since the commencement of the project. There were specific contributors to each intervention so as to ensure the follow-up and reliability.
On review, we found out that documentation was not always done, as the format was kept as a separate sheet. The format was then incorporated in the main case record as a “must fill document” [Figure 5]. This proved to be the Level 3 reliability to effect in sustainability.
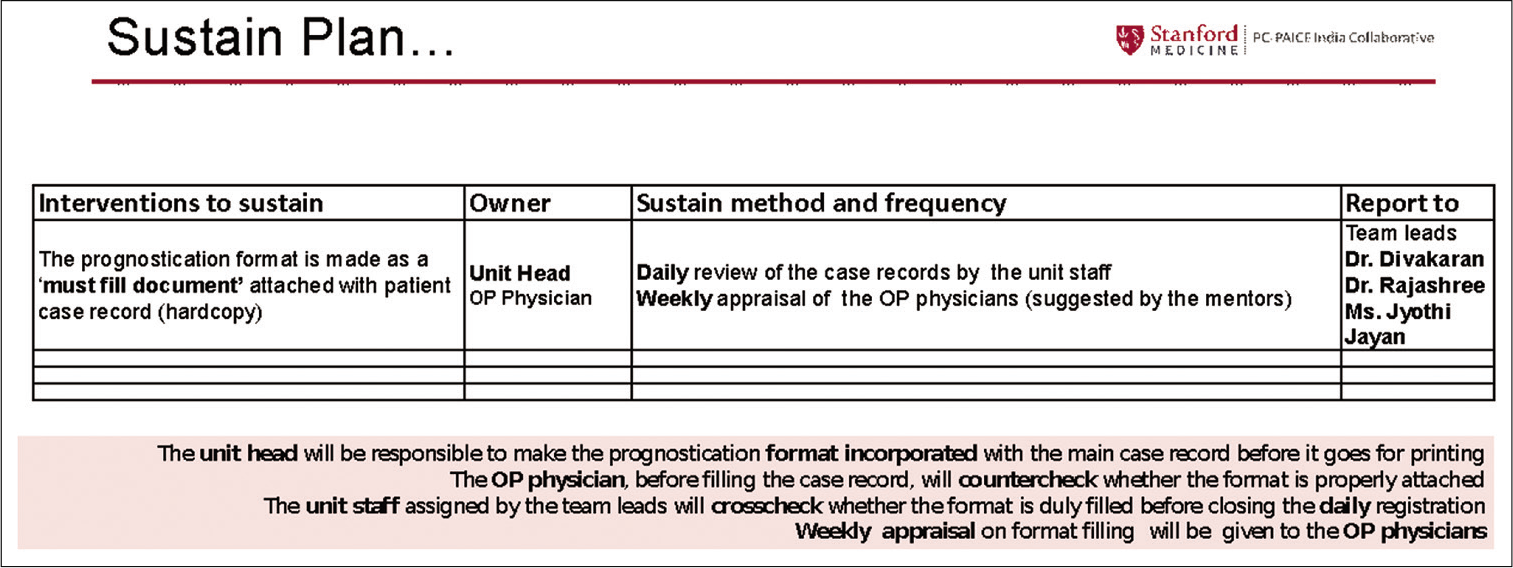
- Sustain Plan
RESULTS
The QI project has helped us in increasing confidence level among the professionals, in discussing the prognostication. The methods helped in enhanced team interaction and professional satisfaction.
Through the new QI Concept and A3 thinking, we also learnt that for effective implementation of a project, there is also a need to consider the human factors. All the team members have to take up ownership of the actions and adapt to changes. We were able to build relations with other palliative care units and learn from their quality projects as well.
DISCUSSION
All other projects started along with us as part of QI program, had set up the SMART goals to fit in their own settings and were successful in achieving the SMART goal. It was found that it was easier than expected, when the team moves with clear direction and commitment. This has led to innovation of the whole concept of QI program to set up the new project as EQuIP India on NCG (National Cancer Grid) e-learning platform, with a vision to quality improvement programs in cancer care and palliative care in India.
Team may start the improvement process without collecting data or take decisions without consulting all team members. Selecting a large and unattainable goal will result in failure. Skipping steps because the solution seemed obvious or not following a definite problem solving process may result in the team wandering aimlessly. Frequently updated and shared chart, proper communication between team members, clear assignment of tasks, and accountability of team members enable smooth run of the project.
The effectiveness of the project is not determined by the quality of solutions alone. Adoption by the people who are doing it is also important. Adoption is to choose or consider the process as one’s own. The process owners should be ready, that is, they should clearly understand the vision and value of work. The process owners should be willing, that is, excited about the value and their role in creating it.The process owners should be able, that is, adequately equipped to support the vision and perform their roles.
Our inference is that QI programs and the A3 concept are easy to follow and adaptable to the any setting, with clear vision, motivation, and correct assignment of tasks to the people. We find that our study is easily adaptable to other health-care scenarios as well.
Challenges
Prognostication discussions are still considered difficult because of the cultural issues. Caregivers evade the discussion of death and dying. In most cases, physicians do not meet the patients at the time of registration and there exists collusion between the family and patients. This makes communication difficult. Post implementation review of the project is a great challenge. A feedback by the care team and assessment of patient satisfaction can effectively measure final outcome of the documentation.
Limitations of our project
Although we were successful in achieving the target, we were not able to measure the outcome, with respect to communication gap and mismatch in expectation in goals of care between the homecare team and patients and family members.
Way forward
The impact of the present project needs to be verified by assessing the satisfaction of patient and/or family through a semi-structured interview by our homecare team.
An extension of discussion on prognostication to non-cancer patients is another plan. We plan to include the goals of cartoon the format and identify the gaps in documentation and process map. Our team has started efforts to improve quality on other domains as well.
Our representations in the role of mentor in QI Projects have paved the way for learning through other’s experience as well. This has opened up the ways to study and analyze our challenges and create clear and meaningful outcomes.
CONCLUSION
We have been successful in implementing a Quality Improvement Project in our unit by developing a format to document the discussion on prognostication. Our team has gained confidence in applying the A3 concept in other domains too.
Acknowledgment
The authors would like to thank Dr CN Parameswaran, Dr Geetha, Dr Sajitha, Dr Chandran, Dr Anitha, and Dr Rose Beena (Clinicians – Institute of Palliative Care, Thrissur).
Declaration of patient consent
Patient’s consent not required as there are no patients in this study.
Financial support and sponsorship
Nil.
Conflicts of interest
There are no conflicts of interest.
References
APPENDIX 1
Prognostication Format
Prognostication discussion points:
Status of the disease according to Palliative Performance Scale: Stable/Transitional/End of Life Care Curative prospects: Curable/Incurable/Incurable and life limiting Expectations of the patient and family from the Palliative Care team: Cure/Comfort Care/Emotional support/ Social (education/food/medicines/schemes) and Financial support Explanation of plan of care from Palliative Care team: Symptom relief/Referral/Psychological support/Social support/Rehabilitation Suggested mode of care: OP/IP/Homecare.
Mention reasons, if any of the above mentioned points could not be discussed
Discussion details:
Patient: Yes/No
No of visit/s (□The entry should be made as 1st/2nd/3rd)
If not discussed, state reasons
Family member: Yes□ No□
No of visit/s (□The entry should be made as 1st/2nd/3rd)
If not discussed, state reasons
Relationship of the family member to the patient:
Spouse Parent/s Son/Daughter Sibling/s Sons/Daughters –in- law Others (state the relationship).
Signature of the physician:
APPENDIX 2
Palliative Performance Scale
The Palliative Performance Scale (PPS) is a valid, reliable functional assessment tool developed by Victoria Hospice that is based on the Karnofsky Performance Scale (KPS) and is incorporated into the collaborative care plans in the Palliative Care Integration Project that began in Kingston. This tool provides a framework for measuring progressive decline in palliative patients.
In the PPS, physical performance is measured in 10% decremental levels from fully ambulatory and healthy (100%) to death (0%). These levels are further differentiated by five observable parameters:
The degree of ambulation Ability to do activities/extent of disease Ability to do self-care Food/fluid intake Level of consciousness
“Stronger” performance indicators are located on the left and “softer” ones on the right. In determining the patient’s PPS then, we would first find the level that fits with the patient’s ambulation level. From that we would work across the scale keeping in mind that the leftward indicators have more value than those on the right. We cannot choose between levels (e.g. 45%). We have to make our best assessment to determine the PPS.
PPS Stages
The PPS can also be broken into three stages according to the performance status and concerns can be monitored
Stable Transitional End-of-Life.
Stable - 100–70%
Concerns
Patient/family’s need for hope/understanding of disease Patient/family education regarding disease management, medications, personal care, nutrition, symptom crisis/ distress management plan Referrals to optimized functioning - physiotherapy/ occupational therapy, dietitian, etc. Psychosocial assessment Spiritual assessment - cultural/religious resources
Transitional - 60–40%
Concerns
Most difficult for patients - impacts on all spheres of life (need for holistic, patient, and family-centered care) Requires greatest amount of nursing care Increasing care and educational needs Coordination of care and services Establishment and maintenance of support systems Education of care givers Symptom management End of life planning
During the transitional stage, we must consider the psychological, social and economic as well as the physical changes a patient experiences to provide holistic, patient and family centered care. Transition is said to be a challenge to a patients’ self-identity. It is therefore, imperative that health-care professionals have an understanding of the transition process to assist patients and their families to move through it.
End of Life ≤30%
Concerns
Review medications/routes of administration, need for further investigations/lab tests/clinic visits Determine main contact in the community - family physician, homecare, and palliative care physician Pain/symptom management Prepare family for death - what do they expect, what are their past experiences with death Ensure affairs are in order - for example, power of attorney, wills, and custody arrangements for children.