Translate this page into:
‘Sufficient Pain relief ’ as a Practical Benchmark in Cancer Pain Management: A Prospective Study of Serial Pain Scores, Patient-rated Pain Relief and Perceived Sufficiency of Analgesics
*Corresponding author: Reena George, Department of Continuing Medical Education, Christian Medical College, Vellore, Tamil Nadu, India. reena.vellore@gmail.com
-
Received: ,
Accepted: ,
How to cite this article: George R, Huang T, Kandasamy R, Siromony HG, Kothandan P. ‘Sufficient pain relief ’ as a practical benchmark in cancer pain management: A prospective study of serial pain scores, patient-rated pain relief and perceived sufficiency of analgesics. Indian J Palliat Care 2022;28:160-6.
Abstract
Objectives:
Serial pain scores are used to guide pain management but there can be variability in what constitutes ‘adequate’ pain relief for an individual patient. We aimed to evaluate how patient-rated sufficiency of pain relief corresponded to pain scores, pain relief scores, and the felt need for increasing analgesics.
Material and Methods:
Baseline and follow-up scores on the 11-point numerical rating scale (11-NRS) and verbal rating scale were obtained for116 patients with cancer pain. Patients used the pain relief sufficiency rating (PRSR) to rate pain relief as ‘no reduction,’ ‘some reduction, but not enough,’ ‘sufficient reduction,’ and ‘very good reduction.’ They also rated analgesics as ‘sufficient’ or ‘insufficient.’ Receiver-operating characteristic (ROC) curve analysis was used to compare PRSR responses with follow-up pain scores, patient rated percentage pain relief, and the perceived need for an increase in analgesics.
Results:
The 11-NRS had an area under the ROC curve of 94.2% against the PRSR. A pain score of three provided the best cutoff to identify adequate pain relief (88.2% sensitivity and 85.7% specificity). Follow-up verbal pain scores corresponded to PRSR categories (severe pain: no reduction; moderate pain: some reduction; mild pain: sufficient reduction and no pain: very good reduction). The PRSR identified 97.3% of patients who wanted analgesics increased and 85% of those who said pain medications were sufficient.
Conclusion:
The PRSR is a brief, simple and intuitive measure to elicit patient perceptions on the sufficiency of pain relief. Our findings suggest that it might be a useful tool in pain and symptom management.
Keywords
Pain measurement
Cancer pain
Pain scores
Pain relief sufficiency rating
Receiver-operating characteristic curves

INTRODUCTION
Pain is one of the most prevalent and distressing symptoms of cancer, with nearly 40% of all cancer patients reporting moderate to severe pain.[1] Because pain is a subjective phenomenon, clinical decisions in pain management depend heavily on the patient’s self-report. Patient-reported pain severity is commonly measured using a variety of scales, including numerical, verbal, and visual analogue scales. In a 0-10 numerical rating scale (11-NRS), the two extremes are anchored by 0 (representing ‘no pain’) and 10 (representing ‘worst possible pain’ or ‘maximum pain’), while in a verbal rating scale (VRS), the two extremes of the scale are anchored by descriptions such as ‘no pain’ and ‘severe pain.’ Both are simple to use, easy to understand, and well-validated.[2]
Changes in patient-reported pain scores for an individual patient typically signal either an improvement or a worsening of pain severity.[3] However, interpretation of pain score changes across patients are complex and challenging. While a small reduction in pain in a large sample may be statistically significant, it might be clinically meaningless when applied to individual patients.[4] One potential solution is the determination of a minimum clinically important difference (MCID), which is the smallest change on a rating scale that represents the pain that is ‘slightly better’ or ‘slightly worse’ from the patient’s perspective.[5] Unfortunately, a recent systematic review of 66 studies concluded that on an 11-NRS, the MCIDs could vary from 1 to 4.9 depending on the severity of baseline pain[6] Other studies have pursued the determination of a substantial clinical benefit, which is the change in a rating scale that represents a substantial clinical improvement to the patient.[7]
Patients with severe cancer pain often need more than a minimum reduction in pain for a worthwhile improvement in quality of life. Given that adequate pain relief is the ultimate goal of evaluating pain severity, we sought to develop a simple pain monitoring tool that directly measures the patient’s rating of pain relief. This tool, the pain relief sufficiency rating (PRSR), asks patients to rate their pain relief as ‘no reduction,’ ‘some reduction, but not enough,’ ‘sufficient reduction,’ or ‘very good reduction.’ To evaluate its clinical ability to discriminate between patients with sufficient pain relief and those without, we aimed to study if the patient-reported outcomes of the PRSR were reflected in validated pain scales. The WHO guidelines for cancer pain management recommend that analgesics be titrated upwards or downwards with the goal of achieving adequate pain relief without unacceptable adverse effects.[8] Therefore, we also wished to assess if the PRSR could guide this clinical decision-making process by investigating whether ‘sufficient’ pain relief on the PRSR could predict the patient’s perception of the sufficiency of pain medications.
MATERIALS AND METHODS
This prospective study was conducted in the Palliative Care Clinic of a teaching hospital in India. Ethics approval was obtained from the Institutional Review Board. Cancer patients attending the palliative care clinic were considered for inclusion in the study if they had pain requiring analgesics and the cognitive capacity to understand and respond to the study questionnaire. After obtaining written informed consent, patients were asked to score the baseline severity of pain using two validated pain scales, the 0-10 NRS (11-NRS) and VRS. A physician then prescribed analgesics (non-opioids/weak opioids/morphine/adjuvants) for baseline and breakthrough pain according to the WHO cancer pain ladder as appropriate for individual patients.[8] The follow-up questionnaire was administered on repeat visits [Table 1]. This included an open question, follow-up 11-NRS and VRS, patient-reported percentage pain relief, and the PRSR. Patients were then asked whether their pain medications were sufficient or if they wanted the physician to increase their analgesics.
| Follow-up pain assessment questionnaire | ||||||||||||
|---|---|---|---|---|---|---|---|---|---|---|---|---|
| 1 | Open Question | How is your pain? | ||||||||||
| 2a | Follow-up VRS | How would you best describe your pain in the last 24 h? Severe Moderate Mild No pain |
||||||||||
| 2b | Follow-up NRS | On a scale of 0-10 in which 0 is no pain and 10 is the worst pain possible, what number would you give your pain in the last 24 h? | ||||||||||
| 0 | 1 | 2 | 3 | 4 | 5 | 6 | 7 | 8 | 9 | 10 | ||
| No pain |
Worst pain Imaginable |
|||||||||||
| 3a | Pain relief percentage | Since you first filled out this questionnaire, how much relief have pain treatments or medications provided? Please circle the one percentage that most shows how much relief you have received. | ||||||||||
| 0% | 10% | 20% | 30% | 40% | 50% | 60% | 70% | 80% | 90% | 100% | ||
| No Relief |
Complete Relief |
|||||||||||
| 3b | Pain Relief Sufficiency Rating (PRSR) |
Please compare your level of pain in the last 24 h with the severity of pain when you first filled the questionnaire. How would you best describe any reduction in your pain? 1. Very good reduction in pain 2. Sufficient reduction in pain 3. Some reduction in pain, but definitely not enough 4. No reduction in pain |
||||||||||
| 4 | Pain medication sufficiency | Would you like us to increase your pain medication or is this sufficient? 1. Increase medication 2. This is sufficient |
||||||||||
Follow-up pain scores on all scales were recorded until ‘sufficient reduction’ was reported on the PRSR or until the last follow-up, whichever occurred earlier. The questionnaires were scored by patients and largely administered by counsellors and social workers, who were not involved in decisions regarding analgesic prescriptions.
Statistical analysis
Receiver-operating characteristic (ROC) curves and areas under the curves (AUCs) are statistical analyses used to compare the discriminative accuracy of diagnostic tools.[9] ROC curves graph sensitivity against 1 – specificity for every value of a diagnostic variable, with the value closest to the top-left corner typically taken as the value with the optimal balance of sensitivity and specificity. Diagnostic tools can then be compared based on the shapes of their respective ROC curves [Figure 1].

- Receiver-operating characteristic (ROC) curve. Diagnostic tools can be compared based on the shapes of their respective ROC curves. (a) In theory, a perfect diagnostic test would contain a value with a sensitivity and specificity of 1. This would result in a ROC curve that starts at (0%, 0%), shoots vertically to (0%, 100%), makes a right angle and runs horizontally to (100%, 100%). In contrast, a diagnostic test that generates a straight diagonal line running from (0%, 0%) to (100%, 100%), as represented by the dashed line, would be no better than a random guess, because it would be as likely to produce false positives as to produce true positives. ROC curves closer to the former would represent better diagnostic tests compared to those that generate ROC curves closer to the latter. These comparisons can be quantified by calculating the areas under the curves (AUCs), where higher AUCs indicate better discrimination. ROC curves are plotted by calculating true positive rates and false positive rates for each cutoff value on a scale. For example, which cutoff value between 0 to 10 best discriminates between those who rated pain relief as sufficient or very good versus insufficient or none.
For our primary analysis, we sought to determine cutoff values on the 11-NRS, VRS, and percentage pain relief scale that best identified patients who had met a clinical standard of adequate pain relief. This clinical standard was defined as PRSR ratings of ‘sufficient’ or ‘very good’ pain relief. Each score on a pain scale was compared with its ability to correctly identify sufficient or better pain relief. Sensitivity and 1 – specificity was first calculated for each score on the pain scale and graphed to create a ROC curve [Figure 1]. The AUCs were compared in order to determine which of the pain scales most strongly tracked with the PRSR. The same was then done for our secondary analysis, which designated ‘sufficient analgesia’ as the clinical standard. We used SPSS 21 to compute frequency statistics and Chi-squares and Dx Test software to generate the ROC curves.
RESULTS
One hundred and sixteen patients with cancer pain participated in the study. The average age was 51 years ranging from 17 years to 80 years. About 57% of patients were women and 43% were men. The most common diagnosis was cancer of the uterine cervix, followed by gastric cancer [Table 2].
| Diagnosis | n | % |
|---|---|---|
| Gynaecological Cancer | 28 | 24 |
| Cervical | 24 | |
| Ovarian | 3 | |
| Uterine | 1 | |
| Gastrointestinal Cancer | 22 | 19 |
| Stomach | 11 | |
| Rectum | 5 | |
| Colon | 2 | |
| Oesophagus | 2 | |
| Anal canal | 1 | |
| Primary unspecified | 1 | |
| Head and neck cancer | 18 | 16 |
| Hypopharynx | 4 | |
| Oral Cavity | 8 | |
| Oropharynx | 2 | |
| Larynx | 2 | |
| Nasal cavity | 1 | |
| Nasopharynx | 1 | |
| Breast Cancer | 10 | 9 |
| Lung Cancer | 6 | 5 |
| Genitourinary Cancer | 5 | 4 |
| Penile | 2 | |
| Prostate | 2 | |
| Urethra | 1 | |
| Hepatobiliary Cancer | 5 | 4 |
| Gallbladder | 2 | |
| Cholangiocarcinoma | 1 | |
| Hepatocellular | 1 | |
| Periampullary | 1 | |
| Musculoskeletal tumours | 5 | 4 |
| Skin Cancer | 2 | 2 |
| Unspecified | 1 | |
| Melanoma | 1 | |
| Lymphoma | 1 | 1 |
| Unknown | 14 | |
| Total | 116 |
Pain reduction
The median 11-NRS pain score at baseline was 7, with 62% of patients grading their pain as ‘severe’ on the VRS. By the last follow-up, 23 patients had rated pain reduction on the PRSR as ‘very good,’ 51 as ‘sufficient,’ 47 as ‘some relief, but not enough’ and 19 as ‘no reduction.’ The patient rating of pain reduction on the PRSR corresponded to the final pain scores on both the 11-NRS and VRS [Figure 2]. For the 11-NRS, the median pain score was 0 in patients with ‘very good’ pain relief, 3 in those with ‘sufficient’ pain relief, 5 in those with ‘some but not enough’ relief, and 8 in those with ‘no reduction.’ For the VRS, the four categories of the PRSR corresponded to ‘no pain,’ ‘mild,’ ‘moderate’ and ‘severe’ pain [Table 3].

- Pain relief sufficiency rating categories versus follow-up responses. (a) Numerical (b) Patient-reported percentage pain reduction (c) Verbal (d) Sufficiency of analgesics.
| Rating/Response | Very good reduction | Sufficient reduction | Some reduction but not enough | No reduction | P-value |
|---|---|---|---|---|---|
| n=23 (%) | n=51 (%) | n=47 (%) | n=19 (%) | ||
| Gender | |||||
| Male | 39.1 | 41.7 | 48.9 | 47.1 | 0.845 |
| Female | 60.9 | 58.3 | 51.1 | 52.9 | |
| Pain Medications | |||||
| Sufficient | 87 | 94.1 | 19.1 | 15.8 | <0.001 |
| You decide/No preference expressed | 8.7 | 5.9 | 25.5 | 31.6 | |
| Increase | 4.3 | 0 | 55.3 | 52.6 | |
| NRS | |||||
| Median | 0 | 3 | 5 | 8 | <0.001 |
| IQR | 0–1 | 0–3 | 4–7 | 5–10 | |
| Range | 0–5 | 0–5 | 1–10 | 3–10 | |
| VRS | |||||
| Mode | No pain | Mild | Moderate | Severe | <0.001 |
| Range | No pain–Mild | No pain–Moderate | Mild–Severe | Mild–Severe | |
| Open question: How is your pain? | |||||
| No pain | 46.1 | 11.9 | 2.8 | 0 | |
| Pain has decreased/fluctuates | 42 | 66.7 | 69.4 | 12.5 | |
| Pain is still there | 7 | 21.5 | 25 | 56 | |
| Pain has increased | 4 | 0.0 | 2.8 | 31 |
PRSR: Pain relief sufficiency rating, VRS: Verbal rating scale, NRS: Numerical rating
ROC analysis
ROC curves were plotted to determine the cutoff at which the 11-NRS best discriminated between patients who had sufficient or very good pain reduction versus those who had insufficient or no pain reduction [Figure 3]. We found that at a pain score cutoff of 3, we could identify 88.2% of those with sufficient pain relief (sensitivity) and 85.7% of those with insufficient pain relief (specificity) [Figure 3a]. Similarly, the best cutoff for the VRS was ‘mild pain,’ with a sensitivity of 93.2% and specificity of 73.8% [Figure 3b]. The AUCs were 94.2% and 90.9% for the 11-NRS and VRS, respectively, indicating very good discrimination between patients with sufficient and insufficient pain relief. The AUC for patient-reported percentage pain relief (83.4%) was lower than that for the 11-NRS and VRS, with a sensitivity of 67.3% and specificity of 88.8%.
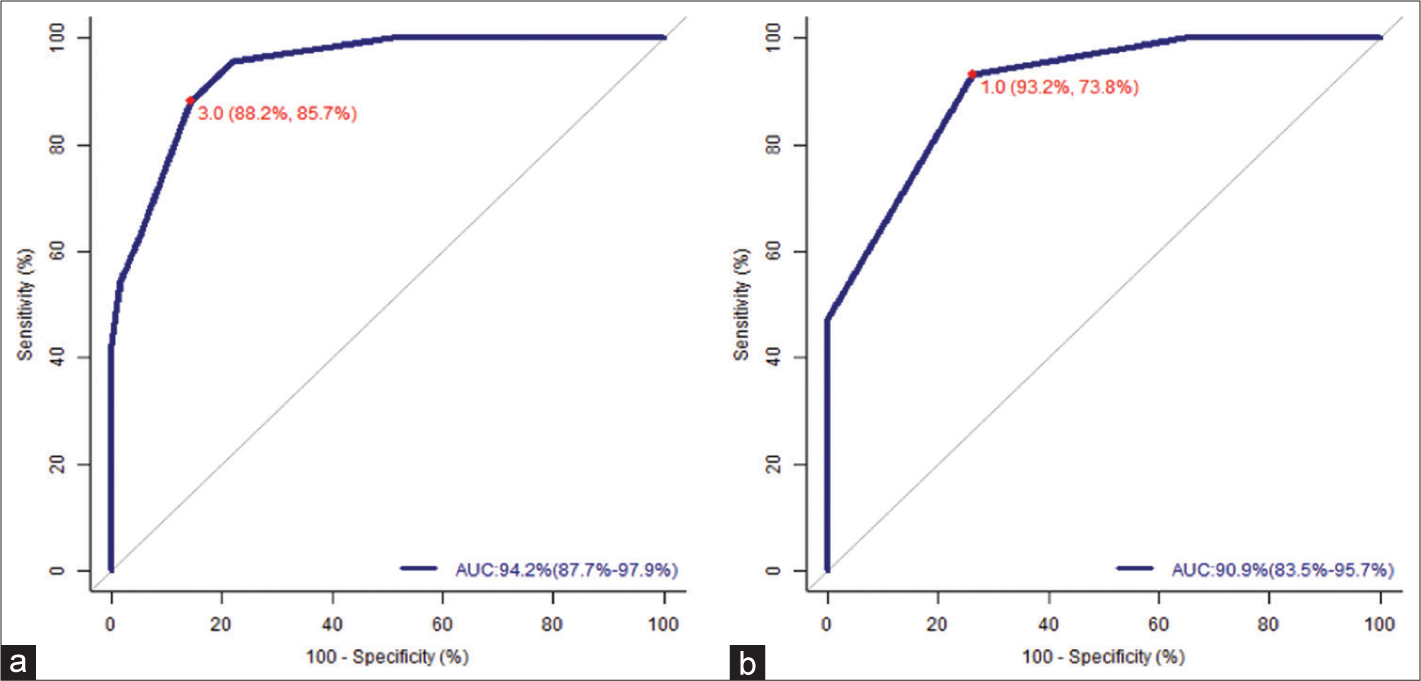
- ROC curves for the study scale (PRSR) versus (a) 11-numerical rating scale (NRS) and (b) verbal rating scale (VRS). An NRS of 3 and a VRS of ‘mild pain’ were the best cut-offs for identifying sufficient (or better) pain relief. The AUCs were 94.2% (NRS) and 90.9% (VRS) indicating very good discrimination between patients with sufficient and insufficient pain relief.
Analgesics
After pain severity and pain relief sufficiency had been scored, patients were asked if they wanted an increase in pain medications. The two middle PRSR categories elicited very different responses regarding analgesic sufficiency. About 94.1% of patients with ‘sufficient relief ’ said analgesics were sufficient as compared to 19.1% of patients who had ‘some pain relief but not enough’ [Table 3]. When the PRSR categories were analysed dichotomously, 97.3% of those who wanted their pain killers increased belonged to the PRSR ‘some relief but not enough’ or ‘no relief ’ categories. Less than 5% of those who reported ‘very good’ or ‘sufficient’ pain relief on the PRSR wanted analgesics to be increased.
DISCUSSION
PRSR versus pain reduction
The NRS and VRS follow-up scores tracked well with progressive PRSR categories [Table 3 and Figure 2]. Farrar et al. reported that a clinically important difference in pain corresponded to a 30% decrease in the 11-NRS. We noted a 38% cutoff threshold for the rating of ‘some relief, but not enough’ in our population.[10] The best cutoffs, for ‘sufficient pain relief,’ that is, NRS = 3 and verbal = mild, are consistent with those reported in the previous literature.[11-13] We found that an NRS cutoff score of 3 correctly identified 88.2% of those with adequate pain relief and 87.5% of those with inadequate pain relief [Figure 3a]. In a large Norwegian study, NRS cutoffs of 3 to 4 identified meaningful pain relief with a sensitivity and specificity of about 80%.[11] The AUC of 90% reported in the Norwegian study is similar to our AUC of 94.2% for the PRSR anchored against the NRS [Figure 3a]. In comparison, Hui et al. reported an AUC of 78.8% when the Patients’ Global Impression scale was anchored against NRS pain in a multi-national palliative care study.[14]
PRSR versus sufficiency of pain medications
Clinical decisions in palliative care should be guided both by the benefits burden ratio and by patient priorities. Some patients with cancer pain would choose to tolerate mild or intermittent pain rather than increase pain medications, while others might prefer sustained pain relief during the palliative phase. The NRS, VRS and PRSR all reflected patient perceptions regarding sufficiency of analgesia better than the percentage pain relief scale [Figure 4a-d]. As compared to the patient-rated percentage pain relief scale, the PRSR had a higher sensitivity (95% vs. 51.9%), specificity (97.3% vs. 89.2%), and AUC (90.5% vs. 73%), in identifying those who wanted an increase in pain medications [Figure 4c and d].

- Receiver-operating characteristic curves for patient-rated sufficiency of analgesics versus 11-numerical rating scale (NRS), verbal rating scale (VRS), patient-reported percentage pain relief and pain relief sufficiency rating (PRSR). (a and b) The best cut-off for the NRS was 4 and for the VRS was ‘mild pain.’ (c) The patient-reported percentage pain relief score had the lowest areas under the curves (AUC). (d) The PRSR had the highest AUC with the best cutoff at ‘sufficient’ pain relief (sensitivity 85% and specificity 97.3%).
Limitations and strengths
A major limitation of the PRSR is that we did not include an option for reporting an increase in pain. This should be added to make a simple 5-point Likert scale. The widely used Global Rating of Change scale is bidirectional, with the two ends represented by ‘much better’ and ‘much worse.’[5,15] Our initial open question, ‘How is your pain?’ provided an opportunity to describe an increase in pain, fluctuations related to activity or medication, and any changes in the site or nature of pain. It is well known that open questions provide valuable information at the beginning of the consultation, which can be missed if the clinician immediately moves to closed questions or rating scales.[16] Interestingly, a significant number of patients who responded to ‘How is your pain’ with ‘pain fluctuates’ or ‘pain is still there,’ then went on to rate pain relief and analgesia as ‘sufficient.’ Had we not used the PRSR, we may have changed or increased painkillers where it was not necessary. By coning down from our initial open question to more closed questions on the sufficiency of pain relief and sufficiency of analgesics, we were able to titrate analgesics guided by patient preferences. The PRSR and VRS are 4-point categorical scales, which could impose limitations in ROC curve analyses.[17]
However, dichotomous PRSR categories of ‘sufficient’ versus ‘insufficient’ pain relief had good sensitivity and specificity for predicting the adequacy of pain medications. Another limitation is that this was a single centre study with a relatively small number of participants, all of whom had cancer pain. Nevertheless, the participants included people of different ages and varying levels of literacy. Some patients found the percentage pain relief scale difficult on the first visit, although they had no difficulty with the PRSR or the other verbal questions. Similarly, a study done in Nepal that investigated the cross-cultural adaptation of pain rating scales, reported that patients found numerical scales slightly more difficult than verbal scales.[18] While the Global Rating of Change scale needed to be reduced from 15 points to 7 points in Nepal, the 4-point PRSR was easily understood by our patients.
The PRSR has several strengths. Its four categories were reflected in validated pain scores (11-NRS, VRS) with minimal overlap. It also had a positive predictive value of over 90% for patients who wanted their pain medications increased. Furthermore, it is brief, easy to understand, and emphasises the patient’s self-report.
Implications for research and practice
The PRSR can be incorporated into the palliative care consultation by asking the question ‘Is the pain reduction sufficient or would you like us to increase pain medications?’ The PRSR categories could also be applied to other symptoms such as nausea where patient-rated outcomes should guide decisions on pharmacological and non-pharmacological interventions. In addition, a 5-point PRSR scale could be used in audits and surveys to estimate the proportion of people with adequate pain relief. Finally, it may have a role in defining responders and computing sample sizes for interventional studies with subjective endpoints.[19]
CONCLUSION
The pain relief sufficiency rating is a brief and feasible tool to capture the patients’ perspective of sufficiency of pain relief and analgesia in cancer pain management.
Declaration of patient consent
The authors certify that they have obtained all appropriate patient consent.
Financial support and sponsorship
Nil.
Conflicts of interest
There are no conflicts of interest.
References
- Update on prevalence of pain in patients with cancer: Systematic review and meta-analysis. J Pain Symptom Manage. 2016;51:1070-90.e9.
- [CrossRef] [PubMed] [Google Scholar]
- The clinical importance of changes in the 0 to 10 numeric rating scale for worst, least, and average pain Intensity: Analyses of data from clinical trials of duloxetine in pain disorders. J Pain. 2010;11:109-18.
- [CrossRef] [PubMed] [Google Scholar]
- Minimal clinically important changes in chronic musculoskeletal pain intensity measured on a numerical rating scale. Eur J Pain. 2004;8:283-91.
- [CrossRef] [PubMed] [Google Scholar]
- Ascertaining the minimal clinically important difference. Control Clin Trials. 1989;10:407-15.
- [CrossRef] [Google Scholar]
- Minimum clinically important differences in chronic pain vary considerably by baseline pain and methodological factors: Systematic review of empirical studies. J Clin Epidemiol. 2018;101:87-106.e2.
- [CrossRef] [PubMed] [Google Scholar]
- Defining substantial clinical benefit following lumbar spine arthrodesis. J Bone Joint Surg Am. 2008;90:1839-47.
- [CrossRef] [PubMed] [Google Scholar]
- WHO's Cancer Pain Ladder for Adults. Available from: https://www.who.int/cancer/palliative/painladder/en [Last accessed on 2021 Jul 10]
- [Google Scholar]
- Statistics review 13: Receiver-operating characteristics curves. Crit Care. 2004;8:508-12.
- [CrossRef] [PubMed] [Google Scholar]
- Clinical importance of changes in chronic pain intensity measured on an 11-point numerical pain rating scale. Pain. 2001;94:149-58.
- [CrossRef] [Google Scholar]
- Follow-up score, change score or percentage change score for determining clinical important outcome following surgery? An observational study from the Norwegian registry for Spine surgery evaluating patient reported outcome measures in lumbar spinal stenosis and lumbar degenerative spondylolisthesis. BMC Musculoskelet Disord. 2019;20:31.
- [CrossRef] [PubMed] [Google Scholar]
- Cut-off points for mild, moderate, and severe pain on the visual analogue scale for pain in patients with chronic musculoskeletal pain. Pain. 2014;155:2545-50.
- [CrossRef] [PubMed] [Google Scholar]
- Menstrual pain assessment: Comparing verbal rating scale (VRS) with numerical rating scales (NRS) as pain measurement tools. Int J Womens Health Wellness. 2016;2:17.
- [CrossRef] [Google Scholar]
- Minimal clinically important differences in the Edmonton symptom assessment scale in cancer patients: A prospective multicenter study. Cancer. 2015;121:3027-35.
- [CrossRef] [PubMed] [Google Scholar]
- Global rating of change scales: A review of strengths and weaknesses and considerations for design. J Man Manip Ther. 2014;17:163-70.
- [CrossRef] [PubMed] [Google Scholar]
- Continuous versus categorical data for ROC analysis: Some quantitative considerations. Acad Radiol. 2001;8:328-34.
- [CrossRef] [Google Scholar]
- Translation, cross-cultural adaptation and psychometric properties of the Nepali versions of numerical pain rating scale and global rating of change. Health Qual Life Outcomes. 2017;15:236.
- [CrossRef] [PubMed] [Google Scholar]
- Interpreting the clinical importance of group differences in chronic pain clinical trials: IMMPACT recommendations. Pain. 2009;146:238-44.
- [CrossRef] [PubMed] [Google Scholar]